

As of April, the total market capitalization of Seoul apartments is 1,689.4981 trillion KRW... Increased by 59 trillion KRW in four months
The market capitalization of apartment buildings in Gangnam-gu, Seoul has surpassed 300 trillion KRW for the first time in history.
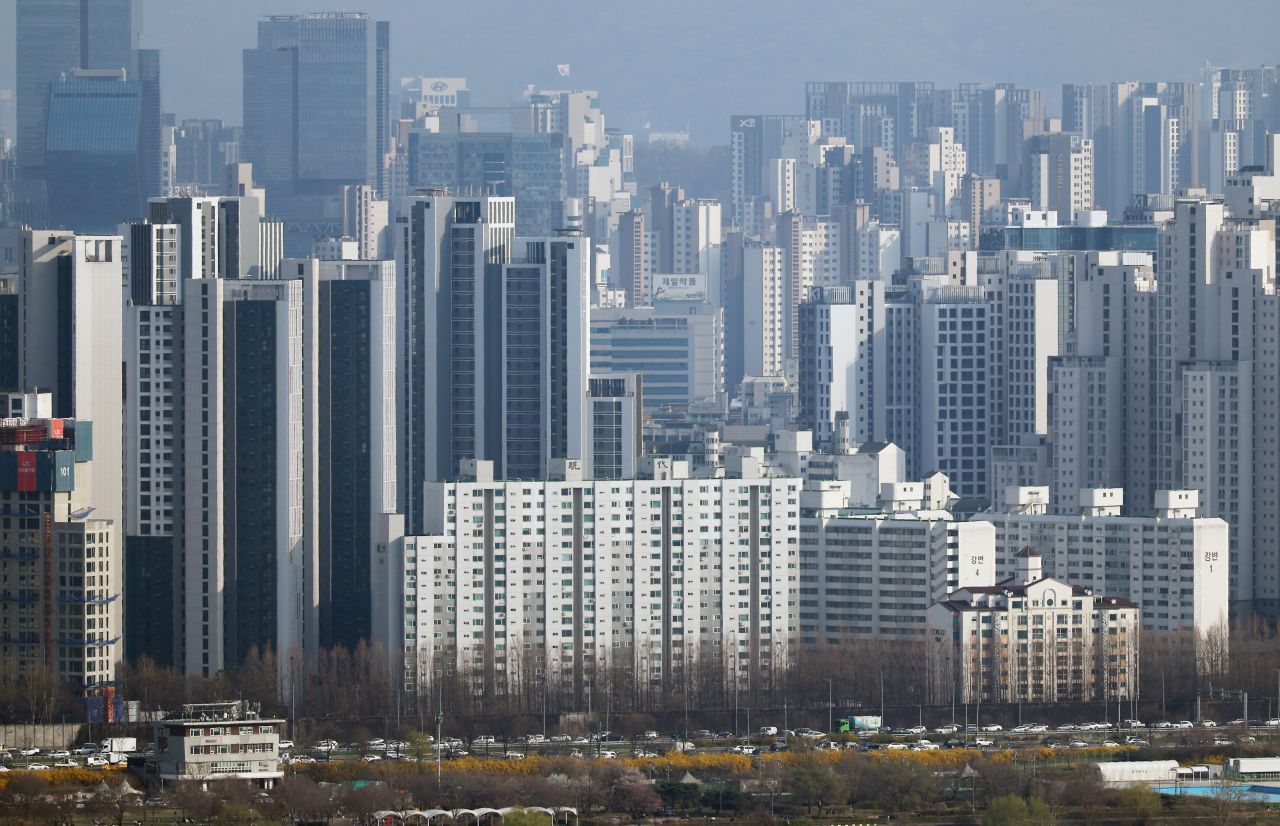
Apartment market capitalization refers to the total sum of the sales prices of all apartments in a particular complex or region. In the Seoul apartment market, the so-called 'Hangang Belt' areas, led by the three Gangnam districts (Gangnam, Seocho, and Songpa), have seen a clear increase in market capitalization, while outer regions have experienced a decrease. This trend is making the polarization in Seoul's real estate market even more pronounced.
Analysts say that income polarization is further intensifying the polarization of residential areas.
According to data on 'Seoul Apartment Sales Market Capitalization by District' provided by Real Estate R114 on June 5, the total market capitalization of Seoul apartments as of April was 1,689.4981 trillion KRW. Compared to December of last year, when the figure was 1,630.0176 trillion KRW, this represents an increase of 3.64% or 59.4805 trillion KRW over four months. Of this increase, the combined rise in the three Gangnam districts amounted to 42.0131 trillion KRW, accounting for 70.8% of the total increase.
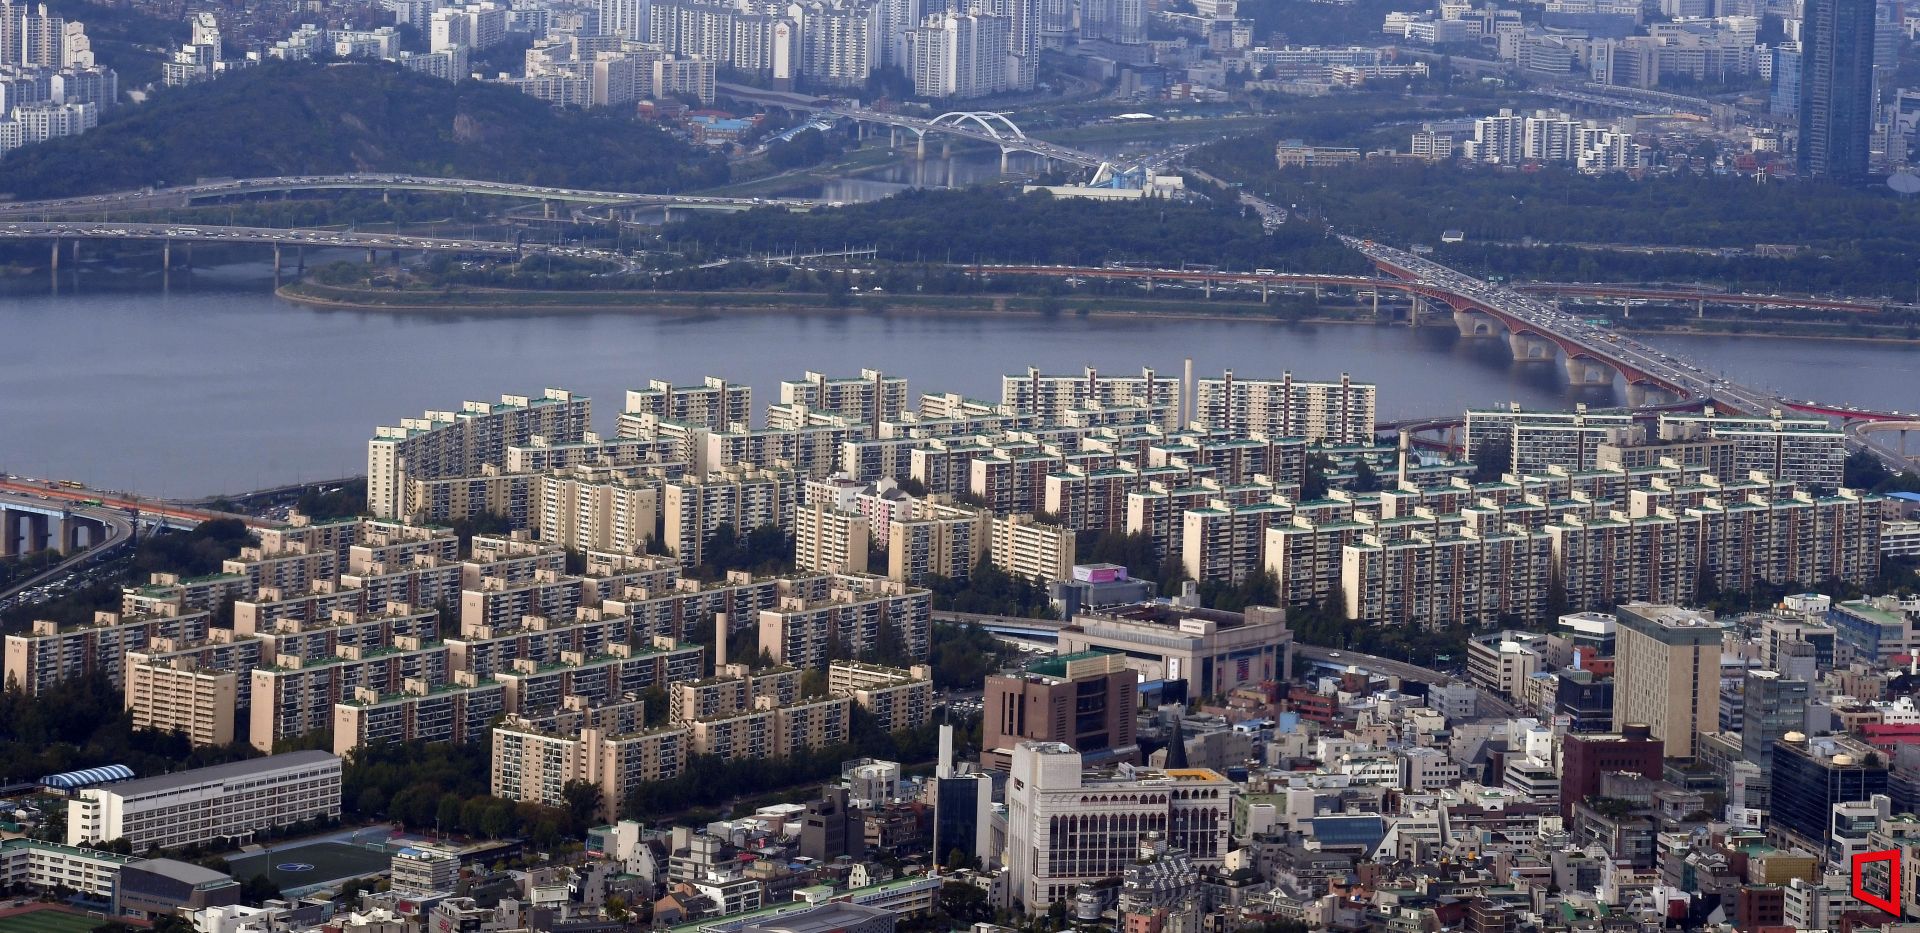
During this period, Gangnam-gu's market capitalization rose from 286.7428 trillion KRW to 303.1334 trillion KRW, an increase of 16.3906 trillion KRW. This marks the first time since Real Estate R114 began compiling statistics that any Seoul district has surpassed 300 trillion KRW in apartment market capitalization. On a monthly average, the market capitalization increased by over 4 trillion KRW. Songpa-gu also saw an increase from 200.5865 trillion KRW to 213.5176 trillion KRW, up by 12.9311 trillion KRW, while Seocho-gu rose from 192.3291 trillion KRW to 205.0205 trillion KRW, up by 12.6914 trillion KRW. In terms of growth rate, Seocho-gu (6.59%) ranked first in Seoul, followed by Songpa-gu (6.45%) and Gangnam-gu (5.72%). The share of the three Gangnam districts in Seoul's total apartment market capitalization also increased by 1 percentage point, from 41.7% to 42.7% during this period.
Demand concentrates only in areas with 'perfect location'... Gangnam 3 districts account for 70% of the increase
Gangnam surpasses 300 trillion KRW, Dobong at 27 trillion KRW... 11 times difference
Following the three Gangnam districts, Seongdong-gu (4.02%), Gangdong-gu (3.47%), Yongsan-gu (3.40%), and Mapo-gu (3.01%)?all areas adjacent to the Han River, known as the 'Hangang Belt'?also ranked high in market capitalization growth. This demonstrates the strong impact of the location premium associated with proximity to the Han River. Yangcheon-gu (2.98%), Dongjak-gu (2.95%), and Jongno-gu (2.77%) followed, rounding out the 'top 10.' These three districts share the common characteristic of being close to the Central Business District (CBD) or the Yeouido Business District (YBD).
In contrast, the outer regions of Seoul?referred to as 'Nodogang' (Nowon, Dobong, Gangbuk) and 'Geumgwan-gu' (Geumcheon, Gwanak, Guro)?saw decreases in market capitalization, except for Gwanak-gu (0.35%). Geumcheon-gu recorded the largest drop, falling by 1.07% from 13.1848 trillion KRW to 13.0440 trillion KRW. This was followed by Gangbuk-gu (-0.62%), Dobong-gu (-0.47%), Nowon-gu (-0.24%), Guro-gu (-0.06%), and Jungnang-gu (-0.05%). Out of Seoul's 25 districts, 6 experienced a decline in market capitalization. These areas share common weaknesses: a low proportion of new apartment buildings, lack of competitiveness in terms of school districts, transportation, and living infrastructure, and less momentum for redevelopment or reconstruction projects compared to the Gangnam area. Among them, the gap in market capitalization between Dobong (27.9777 trillion KRW) and Gangnam is about 11 times.
Ko Jongwan, head of the Korea Asset Management Research Institute, stated, "The polarization of Seoul apartment market capitalization is not merely a real estate issue, but rather a reflection of overall income polarization in society being transferred to residential areas." He added, "As demand concentrates in areas with so-called 'perfect locations'?including education, culture, transportation, green spaces, and hospitals?market capitalization growth is particularly pronounced in core areas such as Gangnam and Yongsan." He further noted, "This is a common phenomenon seen in advanced cities like those in the United States and Japan, and Seoul appears to be following this trend."
-

Reporter Oh Yukyo 5625@asiae.co.kr
-
Edit Kong Sumin hyunhj@asiae.co.kr
© The Asia Business Daily(www.asiae.co.kr). All rights reserved.
!["Please Help Us": How Much Do Those Bowing 90 Degrees These Days Actually Earn? [Data Pick]](https://cwcontent.asiae.co.kr/asiaresize/323/2026052010120870131_1779239528.png)