Bottom 20% Income Decreases, Top 20% Income Increases
In the third quarter of this year, the income of households in the bottom 20% decreased by 0.7%, while the income of households in the top 20% increased by 4.1%. However, statistics showed that the distribution level improved based on the equivalized disposable income quintile ratio.
According to the '3/4 Quarter Household Trend Survey Results' announced by Statistics Korea on the 23rd, the average monthly income of the first quintile (bottom 20%) households in the third quarter was 1,122,000 KRW, a 0.7% decrease compared to the same quarter last year. Disposable income was 907,000 KRW, increasing by 0.6% during the same period. The average propensity to consume fell by 1.7 percentage points to 136.4%.

Compared to the previous third quarter, the only group whose income decreased was the first quintile. Earned income dropped by 9.2% to 263,000 KRW, and business income also decreased by 12.7% to 133,000 KRW. Lee Jin-seok, head of the Household Income and Expenditure Trends Division at Statistics Korea, explained, “There was a decrease in income for temporary daily workers due to a temporary heavy rain,” adding, “Business income declined partly because farmers could not ship their produce on time due to flood damage.”
On the other hand, households in the fifth quintile, representing the top 20%, had an average monthly income of 10,843,000 KRW, a 4.1% increase compared to the same quarter last year. Disposable income also rose by 3.1% to 8,319,000 KRW. The average propensity to consume increased by 1.9 percentage points to 59.2%.
The difference was also notable in consumption expenditure. The average monthly consumption expenditure of first quintile households was 1,237,000 KRW, a 0.7% decrease compared to the same quarter last year. Households in the fifth quintile spent 4,922,000 KRW, marking a 6.5% increase. In terms of consumption expenditure share, food and non-alcoholic beverages accounted for the largest portion at 23.0% for first quintile households, while food and accommodation were the largest at 15.5% for fifth quintile households.
Although the income gap widened, the representative distribution indicator, the quintile ratio, decreased from 5.75 times in the third quarter of the previous year to 5.55 times. The quintile ratio is the value obtained by dividing the average income of the top 20% by the average income of the bottom 20%. A smaller value indicates greater equality.
Lee Jin-seok explained, “When calculating the quintile ratio, we perform an equivalization process because the number of household members varies, so it is not directly indexed,” adding, “The income gap between high-income and low-income groups has narrowed.”
The average monthly income of all households was 5,033,000 KRW, an increase of 3.4%. Earned income (3.5%), property income (16.5%), and transfer income (11.7%) increased, while business income (-0.8%) and non-recurring income (-23.0%) decreased.
Household expenditure rose by 4.0% to 3,871,000 KRW. Consumption expenditure increased by 3.9% to 2,803,000 KRW, and non-consumption expenditure rose by 4.3% to 1,062,000 KRW. Notably, spending on entertainment and culture increased by 16.7%, standing out.
Hot Picks Today
!["Rather Than Endure a 1.5 Million KRW Stipend, I'd Rather Earn 500 Million in the U.S." Top Talent from SNU and KAIST Are Leaving [Scientists Are Disappearing] ①](https://cwcontent.asiae.co.kr/asiaresize/93/2026051914165468840_1779167814.png) "Rather Than Endure a 1.5 Million KRW Stipend, I'd Rather Earn 500 Million in the U.S." Top Talent from SNU and KAIST Are Leaving [Scientists Are Disappearing] ①
"Rather Than Endure a 1.5 Million KRW Stipend, I'd Rather Earn 500 Million in the U.S." Top Talent from SNU and KAIST Are Leaving [Scientists Are Disappearing] ①
- Given Grants, Then Says "No Launch" ... Innovative Korean Technology Ultimately Forced Overseas
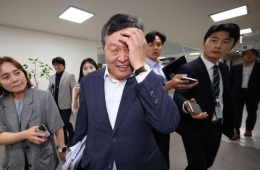
- [Breaking] Chairman Park Sookeun: "Possibility of Agreement Instead of Samsung Electronics Labor-Management Mediation Proposal"
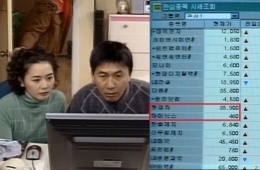
- "If That's the Case, Why Not Just Buy Stocks?" ETFs in Name Only, Now 'Semiconductor-Heavy' and a Playground for Short-Term Traders
- "No Cure Available, Spread Accelerates... Already 105 Dead, American Infected"
Disposable income increased by 3.1% to 3,970,000 KRW. The surplus amount rose by 1.2% to 1,162,000 KRW.
© The Asia Business Daily(www.asiae.co.kr). All rights reserved.
![Cheaper Than Candy, Yet Impossible to Find... Fears of a 'Pediatric Medical Crisis' as Pharmaceutical Companies Halt Production [Why&Next]](https://cwcontent.asiae.co.kr/asiaresize/307/2026051910065268365_1779152813.jpg)