Only Gangnam in Seoul Remains Unbeatable... Apartment Polarization Worsens

[Asia Economy Reporter Kim Hyemin] As the preference for owning a single smart property strengthens, the polarization of apartment prices nationwide has intensified.
It has been pointed out that the gap in housing prices between Seoul and other regions, between low-priced and high-priced apartments, as well as between the Gangnam and Gangbuk areas within Seoul, is widening, with the invincibility of Gangnam in Seoul continuing.
According to the monthly housing price trend time series statistics from KB Kookmin Bank Liv Real Estate on the 30th, the price gap of apartment sales between Seoul and the five major metropolitan cities has widened over the past five years.
In May 2017, when the current government took office, the average apartment sale price in Seoul and the five major metropolitan cities was 607.08 million KRW and 262 million KRW respectively, a difference of 345.08 million KRW. The five major metropolitan cities refer to Busan, Daegu, Gwangju, Ulsan, and Daejeon.
However, in December last year, the average apartment sale price in Seoul rose by 105.9% compared to May 2017 to 1.24978 billion KRW, while the five major metropolitan cities increased by 51.5%, expanding the gap to 852.77 million KRW. At the beginning of the new year, as of January, the average apartment sale price in Seoul was 1.25969 billion KRW, and in the five major metropolitan cities, it was 399.74 million KRW, further widening the gap to 859.95 million KRW.
Polarization within Seoul is also deepening. During the same period, the price gap between apartments in the Gangnam area and the Gangbuk area nearly doubled. The Gangnam area refers to the 14 districts south of the Han River, and the Gangbuk area refers to the 11 districts north of the Han River.
The average apartment sale price in the Gangnam area in January this year was 1.49928 billion KRW. In contrast, the Gangbuk area recorded 998.19 million KRW, a difference of about 510.9 million KRW.
Back in May 2017, the average apartment sale prices in the Gangnam and Gangbuk areas were 733.47 million KRW and 458.64 million KRW respectively, a difference of 274.83 million KRW. However, the gap continued to widen to 330.5 million KRW in January 2018, 377.17 million KRW in 2019, 406.74 million KRW in 2020, 430.22 million KRW in 2021, and expanded to 500 million KRW this year.
The price gap between low-priced and high-priced apartments nationwide has also widened to the largest extent ever recorded. The quintile ratio representing this gap was 9.8 this month, the highest since related surveys began in December 2008. This means that the top 20% of apartments nationwide are 9.8 times more expensive than the bottom 20%.
The average sale price of the bottom 20% of apartments nationwide was 124.07 million KRW, down 840,000 KRW from December last year. On the other hand, the top 20% of apartments averaged 1.21332 billion KRW, rising by 23.57 million KRW, widening the gap. In Seoul, the quintile ratio was the same at 4.2, but the average sale price of the top 20% of apartments exceeded 2.4 billion KRW for the first time.
Hot Picks Today
 No Bacteria Detected in Arisu After 24 Hours of Repeated Drinking from a Tumbler
- "Available Only in Korea": Pokémon Card Prices Surge 2,532% Due to Rarity, Becoming Investment Assets
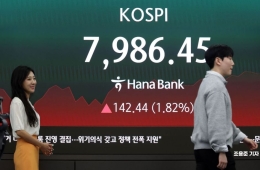
- Staring at Stock Charts Causes 'Hwabyeong'... "What Have I Even Been Doing?" FOMO Spreads Amid Soaring KOSPI
- President Lee: "Agriculture Is a Core Strategic Industry Ensuring Food Sovereignty... Major Transformation of Rural Areas Needed"
- "Egg Prices Are Strange" Proven True... Collusive Margin Hike of 46% Without Basis Leads to 594 Million Won Fine
Hwang Hansol, a research analyst at EconManLab, said, "Recently, mid- to low-priced apartments have been hit hard by loan regulations and interest rate hikes," adding, "The area north of the Han River, which has relatively many mid- to low-priced apartments, is experiencing a strong trend of price decline or stagnation."
© The Asia Business Daily(www.asiae.co.kr). All rights reserved.