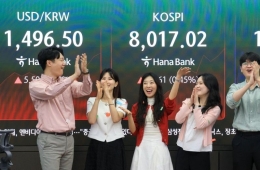
Investors Taking a Brief Pause, Watching... Trading Volume Plummets and Volatility Index Hits Lowest Level
KOSPI Trading Value Down 42% Compared to January
KOSPI Fear Index Hits Lowest This Year

[Asia Economy Reporter Lee Seon-ae] As the KOSPI index moves sideways within a range, investors are showing a clear stance of cautious observation. Trading volume has significantly decreased compared to the beginning of the year, and the so-called 'fear index,' the KOSPI200 Volatility Index (VKOSPI), has dropped to its lowest level this year.
According to the Korea Exchange on the 21st, the average daily trading volume of the KOSPI for 14 trading days from the beginning of March to the 19th was 15.3525 trillion KRW. Compared to the average daily trading volumes in January (26.4778 trillion KRW) and February (19.0954 trillion KRW), the March figure represents a decrease of 42.02% and 19.60%, respectively. On the 15th, the daily trading volume was 12.5809 trillion KRW, the lowest this year. It was the smallest amount in about four months since November 20 last year (12.2662 trillion KRW).
On that day, the trading volume decreased by 71.69% compared to the record-high KOSPI trading volume of 44.4338 trillion KRW on January 11. Also, in March, there has not been a single day when the KOSPI daily trading volume exceeded 20 trillion KRW.
Looking at the daily trading volume trend this year, all 20 trading days in January exceeded 20 trillion KRW, and in February, 5 out of 18 trading days surpassed 20 trillion KRW. The market capitalization turnover ratio, which indicates the ratio of trading volume to market capitalization, also declined. The average daily turnover rate dropped from 1.24% in January to 0.90% in February and 0.73% in March. This is the lowest monthly figure since October last year (0.67%).
Typically, when stock prices rise, the trading volume also increases. Recently, the KOSPI trading volume has shown a trend linked to the KOSPI index movements. At the beginning of January, when the KOSPI surpassed 3,000 points for the first time and surged to 3,200 points intraday, trading volume exploded. The KOSPI daily trading volume, which was 17.9289 trillion KRW on the last trading day of last year, jumped to 25.0114 trillion KRW on the first trading day of the new year, January 4. It then increased to the 40 trillion KRW range, setting a record high, and maintained the 20 trillion KRW level throughout January.
However, as the KOSPI index, which had a heavy burden from the short-term rapid rise, slowed its upward momentum in February, trading volume also took a breather. In March, as the burden of rising interest rates became more pronounced and the index movement stagnated, the decline in trading volume accelerated. The KOSPI reached an intraday high of 3,266.23 on January 11 but has not surpassed that peak for over two months, continuing to move sideways around the 3,000-point level.
Choi Yoo-jun, a researcher at Shinhan Financial Investment, said, "The expansion of interest rate volatility has constrained stock price rises, hindering additional liquidity inflows," adding, "Cash on hand remains at around 60 trillion KRW, so future adjustments in the pace of interest rate hikes will be a signal for capital inflows into the stock market."
As investors take a pause and observe the market, the VKOSPI, which surged sharply at the beginning of the year, has shown signs of downward stabilization this month. The VKOSPI measures the expected future market volatility reflected in option prices and tends to spike sharply when the stock index plunges, hence it is also called the fear index.
According to the Korea Exchange, the VKOSPI stood at 22.69 on the 18th, the lowest since December 30 last year (22.09). Although it slightly rebounded to 23.61 on the 19th, except for the 18th, it still showed the lowest level this year. This indicates that, amid the rising importance of bond yield changes as a key factor influencing the stock market's direction, market participants are refraining from aggressive moves until interest rate risks are somewhat absorbed.
The downward trend in volatility indices is similarly observed in the U.S. stock market. The Chicago Board Options Exchange (CBOE) Volatility Index (VIX) was 20.95 on the 19th (local time), down 7 points from 27.95 at the end of February.
Hot Picks Today
 Cerebras Soars 70% on IPO Debut: Is Nvidia's Reign Ending as a New AI Semiconductor Power Emerges?
- "He's Handsome, It's Such a Pity?"... Lawyer Responds to Bizarre 'Appearance Evaluation' of High School Girl Murder Suspect
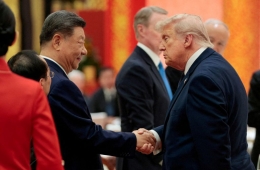
- "After Vowing to Become No. 1 Globally, Sudden Policy Brake Puts Companies’ Massive Investments at Risk"
- "Mom, Isn't It Comfortable Living With Me?"... 'Unexpected Result' Shows Increased Drinking Out of Frustration
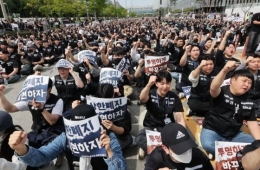
- "Nothing Has Changed": Union Rejects Samsung's Proposal... Further Talks Fail as Strike Proceeds
Jeon Gyun, a researcher at Samsung Securities, explained, "Given the current market atmosphere, investors might be expected to feel fear, but the volatility indicators reflected in the options market show the opposite, which may cause some confusion," adding, "This is because the volatility index currently reflects the market's cautious stance."
© The Asia Business Daily(www.asiae.co.kr). All rights reserved.