KOSPI Hits 7,999 Points... Rises Faster Than the 'Three Lows Boom' of the 1980s
Sixfold Growth in Just 3 Years and 3 Months During the "Three Lows" Boom... Nearly Tripled in the Past Year
The Most Powerful Rally Since the Late 1990s Dot-Com Bubble
IT Sector Led the Dot-Com Bubble, While Semiconductors Dominate Today
Un
As the KOSPI index, which surpassed the 7,000-point mark on May 6, is now closing in on the 8,000-point milestone, both anticipation and fear are prevailing in the market. The current rapid upward momentum has already surpassed the so-called 'three lows boom' of the mid-1980s, often referred to as the golden era of the Korean economy. Some analysts point out that the only comparable precedent is the 'dot-com bubble' at the end of the 1990s.

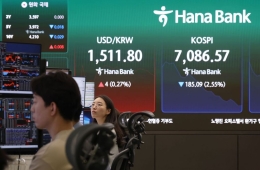
On May 12, the KOSPI opened at 7,953.41, up 1.68% from the previous trading day, and as of 9:50 a.m., it was trading at 7,942.75, up 1.54%. The index briefly touched 7,999.67 points in early trading. At the same time, the KOSDAQ was trading at 1,217.94, up 0.88%. The won-dollar exchange rate opened at 1,475.0 won, an increase of 2.6 won from the previous day, and was trading at 1,480.3 won.
The Korean stock market outpaced Taiwan in terms of market size the previous day, climbing to sixth place globally. The combined market capitalization of KOSPI (USD 422.01 billion) and KOSDAQ (USD 448.3 billion) was estimated at approximately USD 466.21 billion. Taiwan's TAIEX index recorded about USD 433.19 billion. Previously, Korea's stock market capitalization surpassed that of the UK on April 27, and Canada on May 7.
The KOSPI's upward trend is being described as the most powerful since the dot-com bubble. According to Eugene Investment & Securities, the KOSPI has risen 188% from its 52-week low—a highly unusual increase, second only to the 253% surge in July 1999. In fact, the gap between the index and its 200-day moving average has widened to levels seen at the peak of the dot-com bubble in 1999.

It took just 47 trading days for the KOSPI to climb from the 6,000-point mark on February 25 to surpass the dream threshold of 7,000 points. In contrast, it took 18 years and 4 months (from March 31, 1989, to July 25, 2007) for the KOSPI to move from 1,000 to 2,000 points; 13 years and 5 months (from July 25, 2007, to January 7, 2021) to reach 3,000; 4 years and 9 months (from January 7, 2021, to October 27, 2025) to hit 4,000; and just 3 months (from October 27 last year to January 22 this year) to advance from 4,000 to 5,000.
Given that the KOSPI was fluctuating around the 2,500 mark in May last year, the index has nearly tripled in just one year. While this is less dramatic than during the dot-com bubble, it has outpaced the momentum seen during the era of the 'three lows' (low interest rates, low oil prices, and a weak dollar). In early 1986, the KOSPI hovered around 160 points and first broke through the 1,000-point barrier at the end of March 1989—a nearly sixfold increase in 3 years and 3 months.

Looking at the 'three lows boom' rally, it is notable that corrections occurred twice as frequently as normal years, contrary to general expectations. Comparing the frequency of short-term corrections of -10% or more, in an average year, a correction occurred about once a year, but during a bull market, it was about twice a year. This implies that there is a likelihood of one correction in the first half and another in the second half of the year. Historical patterns show that corrections tended to cluster in March-April and September-November. Coincidentally, after 3-4 months of gains during a bull market, tightening policies to cool off overheating often led to 1-2 months of corrections.
However, KB Securities analyzed that merely entering the overheated zone does not itself trigger a stock market collapse. Overheating can increase volatility, but a true correction requires the presence of uncertainty and fear sufficient to undermine investor sentiment. A decline in the absence of fear is likely to remain a short-term drop lasting a day or two, followed by a quick rebound. The key risk lies in a potential shift in U.S. policy direction. The current market is pricing in three interest rate cuts, and the end of the Federal Reserve's rate-cutting cycle will be a critical moment. Additional variables that must be monitored include the response strategies of big tech (large IT companies), the rise of China's semiconductor industry, and geopolitical risks.
Meanwhile, underlying the current powerful rally are concerns about excessive concentration in the semiconductor sector. Excluding semiconductors, the KOSPI index stands at only about 4,100, and only one-third of all sectors have reached new highs this year. This imbalance is clearly reflected in market capitalization weights. As of the close on May 11, Samsung Electronics (market cap of about KRW 1,669 trillion) and SK hynix (about KRW 1,339 trillion) accounted for 26.0% and 20.9% of the KOSPI, respectively. Their combined market cap reached KRW 3,008.9929 trillion, representing 46.9% of the total. If you include SK Square (2.4%), which holds about 20% of SK hynix shares, the proportion rises to 49.3%.
The concentration toward industries such as semiconductors, power, and space—driven by artificial intelligence (AI)—is likely to continue. As a large influx of individual funds enters the market, institutional investors are also compelled to focus on leading stocks with strong earnings to avoid being left behind in terms of returns. In fact, in the late stages of the dot-com bubble in 1999, even healthcare and finance were dropped from the list of leading stocks, with only dot-com stocks soaring—a trend that some analysts see as similar to the current dominance of semiconductors.
However, there are clear differences from the past dot-com bubble. While previous surges were driven by vague expectations or speculative valuations, the current rally is supported by upward earnings revisions. In particular, profit estimates for the semiconductor sector have skyrocketed. According to Eugene Investment & Securities, the estimated operating profit for semiconductors, which stood at KRW 340 trillion at the end of February, surged to KRW 580 trillion in early May—an increase of more than 70% in just over two months. The total estimated operating profit for the KOSPI also rose to KRW 867 trillion. Based on these profit forecasts, the fair value range for the KOSPI is calculated to be between 8,100 and 9,800 points.
Hot Picks Today
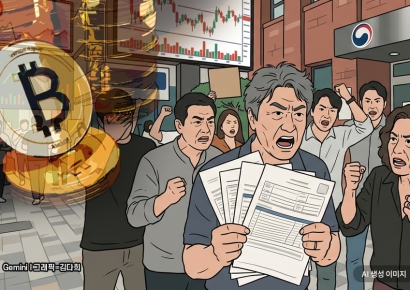 "Stocks Are Not Taxed, but Annual Crypto Gains Over 2.5 Million Won to Be Taxed Next Year... Investors Push Back"
- "Not Jealous of Winning the Lottery"... Entire Village Stunned as 200 Million Won Jackpot of Wild Ginseng Cluster Discovered at Jirisan
- One in 77 Koreans Exposed to Drugs... Enough Money for 6,600 Luxury Gangnam Apartments Circulates in Drug Market [ChwiYakGukga] ⑩
- "Greater Impact on Women Than Men"... The 'Diet Trap' That Causes Sleepless Nights and Suffering
- "Even With a 90 Million Won Salary and Bonuses, It Doesn’t Feel Like Much"... A Latecomer Rookie Who Beat 70 to 1 Odds [Scientists Are Disappearing] ③
Heo Jaehwan, a researcher at Eugene Investment & Securities, said, "The concentration in semiconductors and the KOSPI has intensified, and most non-semiconductor sectors are failing to keep up with the KOSPI's rise. Even if the Iran war ends, the marginalization of consumer stocks and the KOSDAQ is likely to continue through the first half of the year, and caution is advised for industries with little connection to AI data centers." He added, "A positive outlook for the domestic stock market remains valid, but the rapid pace of the short-term rally should be taken into account. The risk to watch is the potential slowdown in semiconductor exports. While both exports and profits are increasing, the base effect of the growth rate is likely to gradually weaken after the second and third quarters."
© The Asia Business Daily(www.asiae.co.kr). All rights reserved.