3 KOSPI Bottom Signals: '30% Drop Rate, 88% Divergence, No Leading Sector'... "Prepare Strategy for Earnings Recession Market"

[Asia Economy Reporter Lee Seon-ae] The domestic stock market, which has entered a 'bear market,' is showing signs of a 'profit recession market' where stock prices and earnings are falling simultaneously. As a result, there is a busy focus on gauging the market bottom, and currently, many voices suggest that market indicators are close to the bottom. However, since uncertainties remain, some advice has been raised that it is necessary to keep open the possibility of further declines in the bottom due to additional negative factors.
Three Indicators to Gauge the KOSPI Bottom
There are various indicators that can confirm that the domestic stock market is currently at a low point. These can be checked through the rate of decline, deviation, and leading industries. According to the Korea Exchange on the 15th, the KOSPI reached an all-time high of 3305 on July 6 last year and then underwent a correction for a year. The decline rate from the peak is 30%. Since 1991, the decline has exceeded 30% seven times in total: August 1992 (current account deficit after the Seoul Olympics), June 1998 (foreign exchange crisis), September 2001 (dot-com bubble burst), March 2003 (Iraq War and North Korean nuclear crisis), October 2008 (financial crisis), March 2020 (COVID-19 outbreak), and now. Park Seung-young, a researcher at Hanwha Investment & Securities, pointed out, "The current intensity of the correction is no different from a global crisis or recession level."
Next is the fact that the 20-week deviation recorded 88%. Stock prices rise slowly and fall quickly, so when stock prices hit the bottom, the deviation from the past average widens significantly. Short-term bottoms often show a large 20-day deviation, but medium-term bottoms are usually gauged by the 20-week deviation. Representative phases with large 20-week deviations, listed by intensity, are 60% during the foreign exchange crisis, 63% during the financial crisis, 74% during the COVID-19 outbreak, 75% during the dot-com bubble burst, and 84% during the US credit rating downgrade. Just a few days ago, on July 1, it widened to 88%. The cause of this correction is not due to an unexpected event but stems from economic slowdown and the shift to tightening monetary policy.
The absence of leading industries based on market capitalization also indicates proximity to the bottom. Leading industries and stocks have changed, but concentration and relaxation have always existed. At the peak of the 2000 dot-com bubble, five of the top 10 stocks by market capitalization were telecommunications stocks. At the 2001 bottom, telecommunications stocks decreased to three, while Kookmin Bank, Hyundai Motor, and KT&G re-entered the top 10. At the October 2007 peak, Hyundai Heavy Industries, SK Innovation, and Doosan Heavy Industries were in the top 10, but a year later, KT&G, Hyundai Motor, and LG Electronics entered the top 10. Comparing July 2021 and now, the top 10 stocks by market capitalization have changed in ranking but no stocks have entered or exited. However, expanding the range to the top 30, the number of IT sector stocks decreased from 7 to 4, and communication sector stocks decreased from 4 to 3. The number of stocks in industrials, finance, energy, and consumer staples increased within the top 30. Although there is no ideal sector ratio, it is confirmed that at the stock index bottom, the sectors of the top market capitalization stocks tend to be more evenly distributed. Based on the top 30 by market capitalization, the current sector distribution is even more balanced than at the March 2020 bottom. Researcher Park emphasized, "Near the bottom, investors tend to have less conviction about specific sectors or stocks," adding, "The current sector distribution indicates that the KOSPI is close to the bottom."
Further Decline in Bottom Depends on Additional Negative Factors
Although there are many indicators confirming the bottom, since the market has entered a profit recession phase, premature certainty about the bottom is unwise. In a profit recession market, the decline in earnings is larger than the drop in stock prices, and stock prices reach the bottom 2 to 5 months later. This is because the market first experiences a correction in a reverse financial market where the previous peak was high. After confirming the bottom, stock prices fluctuate sideways, repeating rebounds and declines. The rebound magnitude varies depending on the lowered price base but is generally around 10-20% compared to the bottom. A similar trend is likely to be seen in the current phase until the market shifts to a financial market.
However, caution is required as the bottom may decline further. Looking at the profit recession market since the second half of 2002, multiple negative factors such as the North Korean nuclear issue, credit card crisis, and accounting fraud controversies caused a 'Korea discount' (undervaluation of the Korean stock market). The Iraq War also contributed to further lowering the bottom. In 2018, the trade dispute escalated into a US-China hegemony war, and the Brexit issue (the UK's withdrawal from the EU) was added. Choi Yoo-jun, a researcher at Shinhan Investment Corp., said, "The current major negative factor, inflationary pressure, is expected to ease in the third quarter, and stock price trends are also expected to improve," but warned, "If additional negative factors appear contrary to expectations, the stock price bottom could be lower."
Hot Picks Today
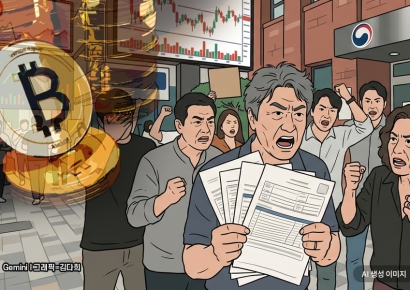 "Stocks Are Not Taxed, but Annual Crypto Gains Over 2.5 Million Won to Be Taxed Next Year... Investors Push Back"
- "Not Jealous of Winning the Lottery"... Entire Village Stunned as 200 Million Won Jackpot of Wild Ginseng Cluster Discovered at Jirisan
- "Jeong Yu-kyung Is a Neighbor"...Itaewon Standalone House with Record 23.2 Billion Won Appraisal Up for Auction [Real Estate AtoZ]
- "How Did an Employee Who Loved Samsung End Up Like This?"... Past Video of Samsung Electronics Union Chairman Resurfaces
- "Even With a 90 Million Won Salary and Bonuses, It Doesn’t Feel Like Much"... A Latecomer Rookie Who Beat 70 to 1 Odds [Scientists Are Disappearing] ③
The securities industry advised that, given the ongoing uncertainties, investment strategies effective in a profit recession market should be devised. This means differentiated responses by sector are necessary. In past profit recession markets, defensive stocks such as telecommunications and consumer staples, and sectors that secured growth drivers at different times, performed relatively well. In contrast, sensitive stocks such as machinery, display, and steel underperformed. Researcher Choi said, "At this point, an approach to defensive stocks is considered effective," adding, "Selective approaches to the secondary battery value chain, where visible growth is expected, should also be considered."
© The Asia Business Daily(www.asiae.co.kr). All rights reserved.