'2024 Seoul Welfare Status Survey' Report
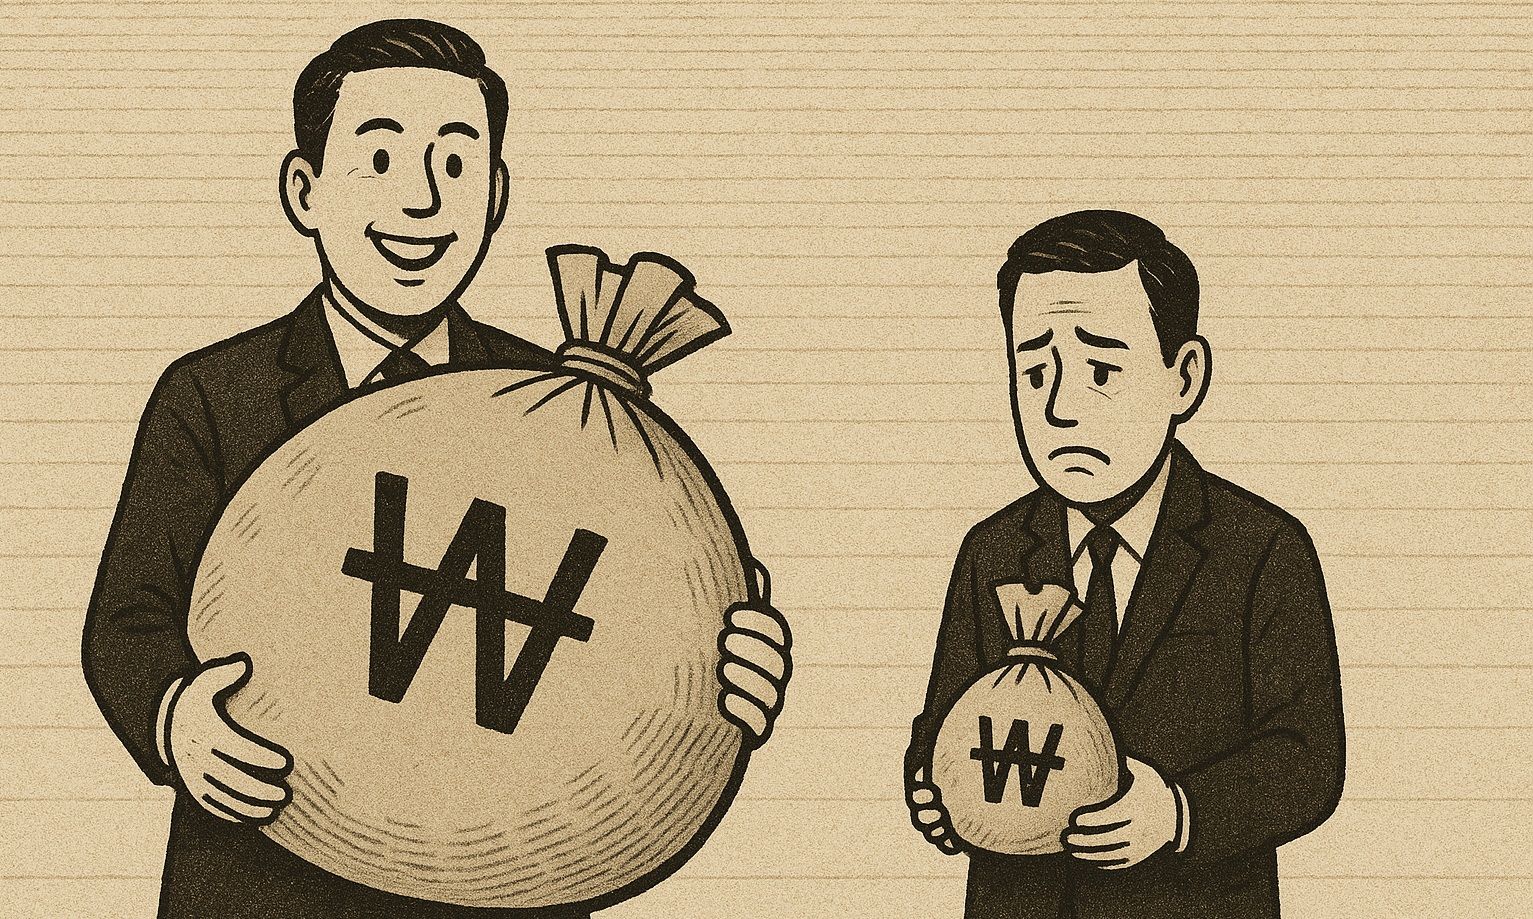
The total income gap between the top 20% and bottom 20% income groups is 4.6 times.
The "poor" households, defined as those earning 50% or less of the median income, have an average monthly living expense of 1.15 million won.
This is less than half the 2.86 million won spent by non-poor households.
Average monthly medical expenses are higher for the poor at 42,000 won.
37% of the poor said medical costs are a burden.
A survey found that the total income of high-income and low-income households in Seoul
differs by a factor of 4.6.
According to the '2024 Seoul Welfare Status Survey' report by the Seoul Institute released on September 11, 2025,
the total income of the highest income quintile in Seoul
124.81 million won,
was 4.6 times higher than that of the lowest income quintile (27.03 million won).
The fifth quintile refers to the top 20% income households, while the first quintile refers to the bottom 20%.
This result is based on a survey of 3,004 households living in Seoul, conducted by the institute over two months from September 2 to October 31 last year.
Total income is defined as the sum of earned income, business income, property income,
public transfer income, private transfer income, and other income.


"Could not go to the hospital due to lack of money" - 13% of low-income households, 2.5% of general households
The average total income of the sample group was 64.23 million won.
The average was higher than the median of 58 million won,
indicating a relatively larger proportion of low-income households.
The institute explained, "Interpretation should be made with caution, as low-income households may have been underrepresented in the sample."
7.3% of respondents said they had experienced
at least one "deprivation experience," such as falling behind on rent
or being unable to pay for their children's public education.
Deprivation experiences were more common among low-income households than general households.
For the question "Have you ever been unable to pay utility bills on time due to lack of money?",
12.3% of low-income households and 2.3% of general households answered yes.
For the question "Have you or a family member ever been unable to go to the hospital due to lack of money?",
13.0% of low-income households reported such experiences, compared to 2.5% of general households.

Average monthly living expenses for non-poor households were 2.86 million won,
more than twice that of the poor (1.15 million won).
The poor are defined as households with incomes at or below 50% of the median income.
Average monthly medical expenses were 35,000 won for non-poor households,
while the poor spent 42,000 won, meaning the poor spent more.
The proportion of respondents who said medical expenses were a burden
was higher among the poor (37.0%) than among the non-poor (16.7%).
The average total assets of the sample households amounted to 606.19 million won,
average debt was 44.96 million won, and average net assets were 561.23 million won.

Housing costs remain a burden... Price-to-income ratio averages 11.4 times
Indicators related to housing showed that the burden of housing costs remains high.
The "price-to-income ratio (PIR)"-the ratio of household income to housing price-
averaged 11.4 times.
The ratio of housing costs to monthly income averaged 35.2%.
According to the Ministry of Land, Infrastructure and Transport's minimum housing standards,
4.2% of households failed to meet at least one criterion among room number, area, or facilities.
Among young people aged 15 to 29,
the proportion of "NEETs" (Not in Employment, Education, or Training) was 4.6%.
This is higher than the 2022 survey result of 3.6%.
-
Reporter Kim Youngwon forever@asiae.co.kr
-
Edit Choo Myeonghoon chox2mh@asiae.co.kr
© The Asia Business Daily(www.asiae.co.kr). All rights reserved.
!["Please Help Us": How Much Do Those Bowing 90 Degrees These Days Actually Earn? [Data Pick]](https://cwcontent.asiae.co.kr/asiaresize/323/2026052010120870131_1779239528.png)